
Forecasting: What could it do for you and how?
Forecasting different aspects of your business is a key element of growth and risk mitigation that cannot be ignored! Great forecasting helps growing businesses to develop and feeds into the strategic planning process.
Forecasting gives the user a measured indication of how knowledgeable they are of the business marketplace, and how adaptable their business is to change, crisis’s or miracles!
What benefits will I see from forecasting?
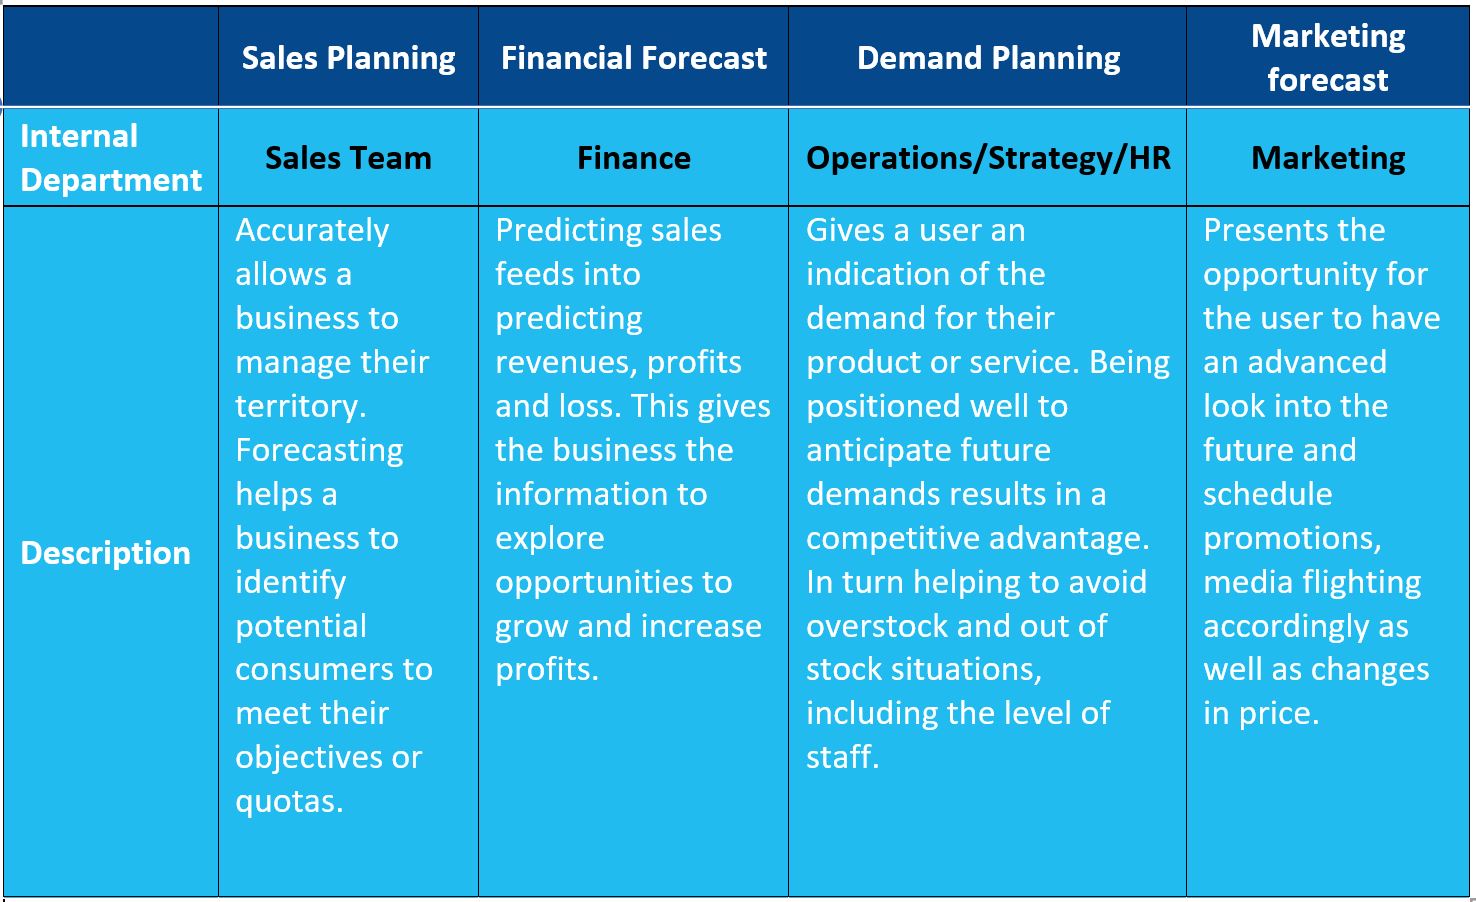
There are a number of stakeholders in different parts of a business that can benefit from forecasted results. The table below outlines the benefits and whom it would be of use to.
Sounds good, but how do I do this?
Great question! MMM is one of many great solutions, as statistical analysis potentially combined with machine learning can solve curiosity of the future. A common method used when forecasting is to split your data into two parts; training data, test data.
Say you would like to predict flower sales for company A, and you have data around sales and the key drivers which contribute to the sales of flowers. To implement the strategy above, you would split the data to a large subset of the full data which you wish to build a model on, this is your ‘Training data’. Carve a smaller subset of your data, which is not included in the training data which you wish to test the trained model on, this is your ‘test data’. Test data serves as a proxy for new/future data. Many statisticians state the optimal split is 80:20 respectively.

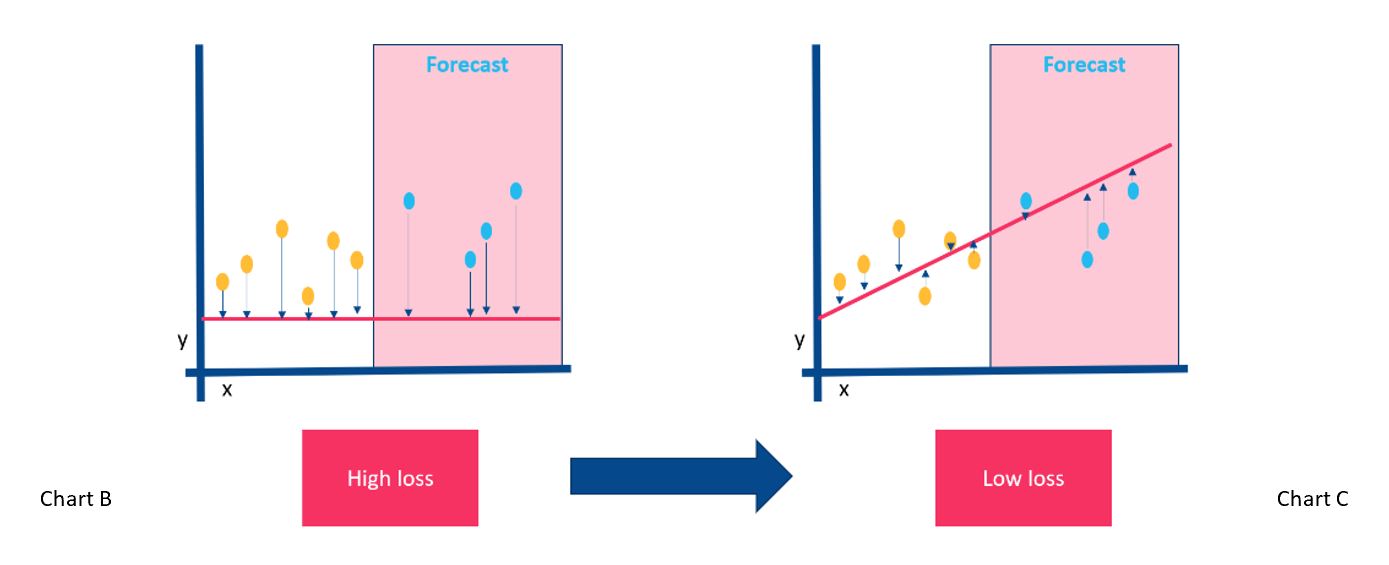
Chart A above illustrates the process of training and test data analysis. The goal is to create a model which minimises loss, becoming a basis to forecast future events. Below the charts compare the differences, between the high loss and low loss models forecasting capabilities, built upon the same events. Following our flower example, below Chart B predicts flower sales over time, given the data and model constructed represented by the red line. The blue points on the graph represent new flower sales data and the arrows show how close the model was to predicting those sale points. Undeniably, Chart C has the better flower sales prediction model as the blue points are closer to our model, achieving our low loss objective.
Ultimately decision makers want an advanced look into the future. At Brightblue Consulting, this is one of many services available to help key decisions be made, which are backed by data-driven evidence and data centric predictions. For marketers that means advised optimal performances of media plans, flighting and the correct scheduling of price and promotions.
Brightblue Consulting are a London based consultancy which help businesses drive incremental profit from their data. We provide predictive analytics that enable clients to make informed decisions based on data and industry knowledge. Through Market Mix Modelling, a strand of Econometrics, Brightblue has a proven track record showing a 30% improvement in marketing Return on Investment for clients’ spend. If you are interested to find out more please contact us through email by clicking here and one of our consultants will get back to you shortly.