
Out of the Blue – June 2019 Newsletter
THIS MONTH WE FOCUS ON:
We don’t like cricket… we love it!
Recent advancements in technology and a continued focus on data driven strategy in sport, has led to cricket becoming an increasingly data rich sport. So with this years’ Cricket World Cup in full spin, we take a look at just a few examples…
| What data reveals about each country’s World Cup chances Using data from 1 day internationals over the past eight years, the Guardian have plotted how each country might fare at the World Cup. The data reveals strong all-round chances for the hosts, England (fingers crossed!) |  |
 | Every match played in the 1983 World Cup England have hosted the most World Cups, with a total of 5. In 1983 India won their first ever World Cup and here Krunal Palande, has visualised the entire tournament, in one beautiful, clock style visual. |
| How data analytics is changing cricket Teams are increasingly using advanced analytics to optimise player performance. Recent developments in tech has led to a much deeper understanding of how a batsman’ body responds to differing types and speed of bowling deliveries. | 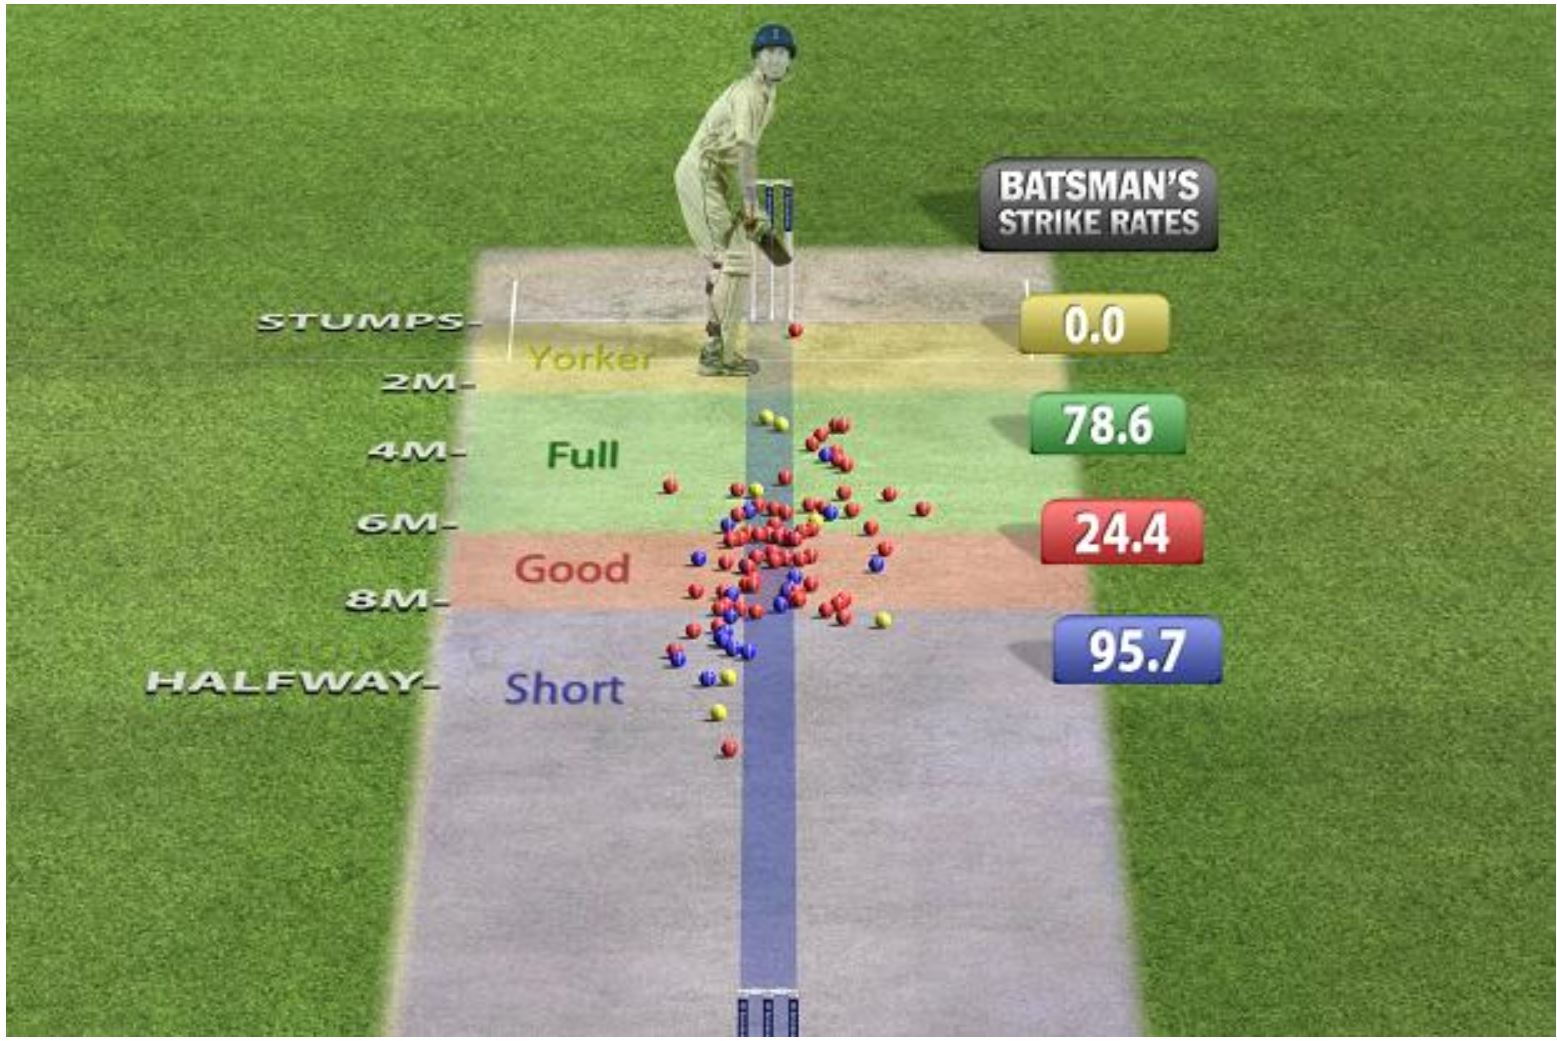 |
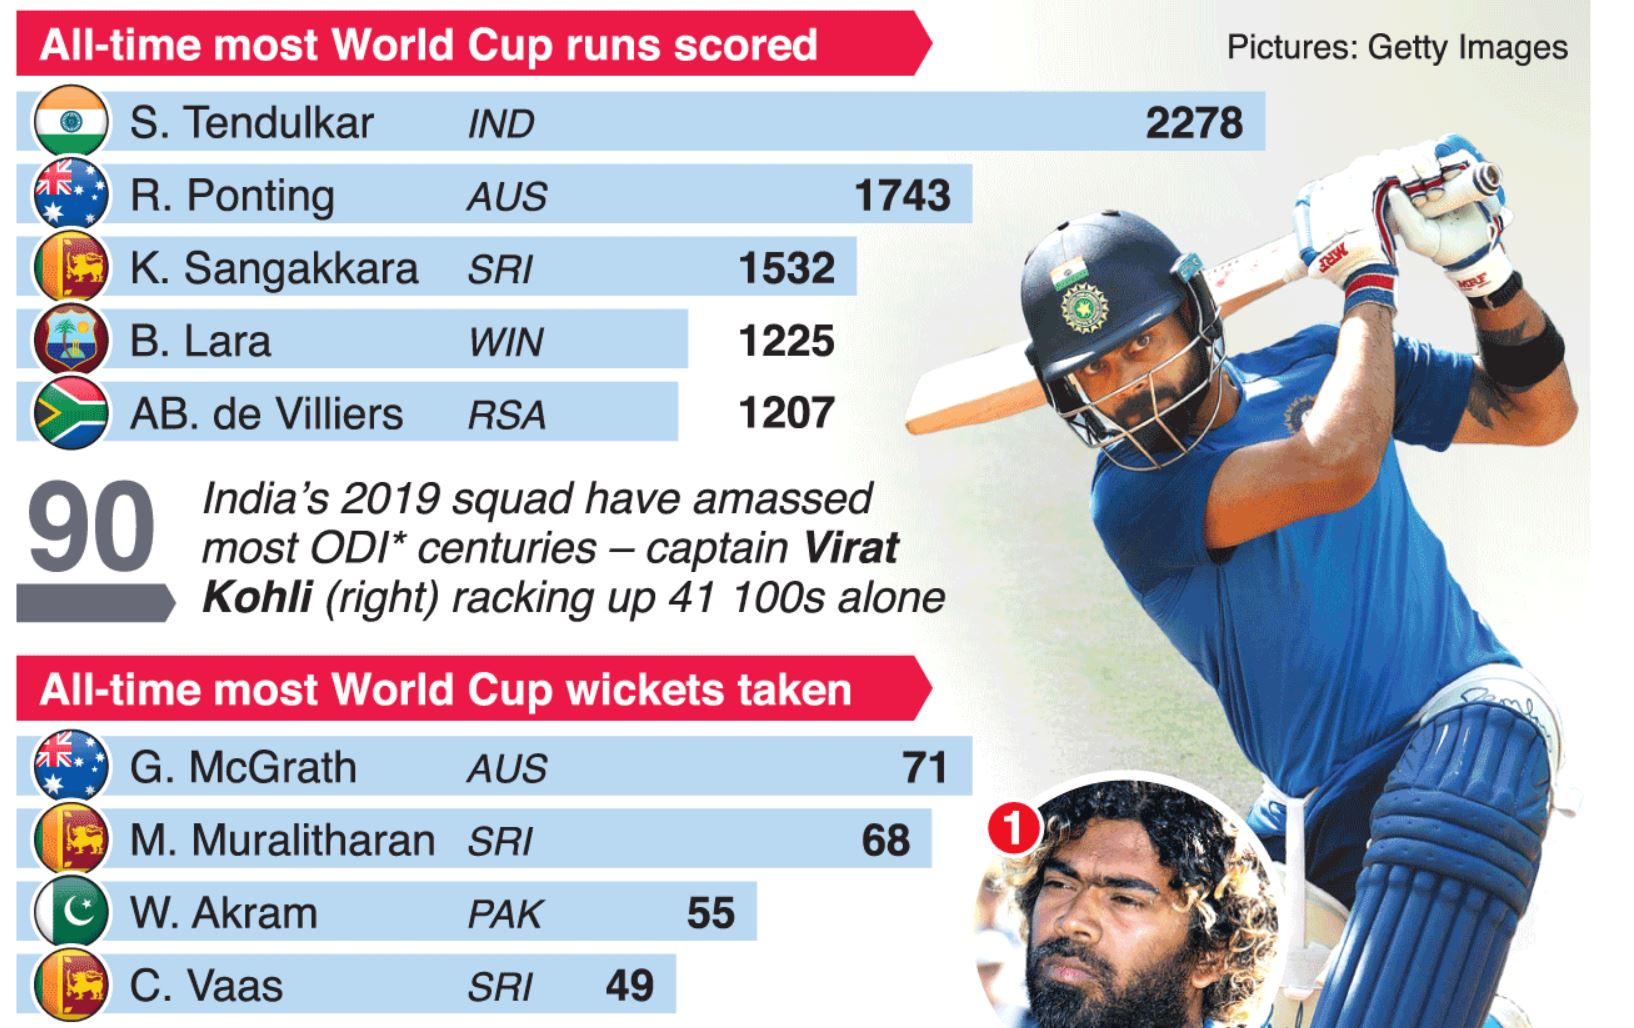 | Cricket World Cup facts and figures! A total of 48 matches will be played at 11 venues over six weeks, with the final taking place at Lord’s, in London, on July 14. Let’s see some fun statistics! |
So if you’re following the cricket – best of luck to your team! If not- maybe this song will inspire you..
Thanks,
Cath