
Budgeting: Optimise Global Media
Maximising the ROI on global media requires a transparent budgeting system that achieves harmony between national and global budget holders’ objectives.
Having worked in the international area of marketing ROI for a number of years, I have found that one of the constant bugbears for global or central media directors and CFOs is how to spend budgets across markets. Inevitably the annual budget review is one of the most difficult times in the marketing calendar due to the trade-off between national marketing directors wanting to protect their budgets versus the global or central media director having a finite budget to share across these markets.
This subject becomes all the more pertinent in the current economic climate where budgets are being cut and these cuts need to be made where the impact on the business is minimised.
The most common case that central teams are faced with in setting budgets is the feedback loop (RoderickWhite, How To Use Your Budgets Better, Admap, March 2008) -a multi-stage process where the individual markets are asked how much they need. This inevitably ends up in a circular process that goes something like this:
- Round one: Central media director/CFO tasks markets to come back with a detailed plan on media requirements to hit targets (two month’s duration).
- Round two: After each market has submitted their budgets, central media director and CFO ‘level’ the budget – i.e. overlay a reality check on each market while also shaving an amount off all markets collective estimated budget to align with the actual global/European budget (one month).
- Round three: Budgets submitted back to local markets, where they have a chance to re-justify their budgets with fact-based proof of why they would need incremental monies (one month).
- Round four: Final stage of ‘levelling’ by the central team and budgets are given to the markets (½ month).
- Round five: Potential repeat(s) of rounds three and four (further months…).
This process works effectively if three assumptions hold: local markets know how media affects their targets (sales/profit); all markets use the same logic, assumptions and data sources; and no market over-estimates in an attempt to raise a higher local budget.
Now, clearly, any national marketing director worth their salt will build a business case that will over-estimate what they actually need in order to get the budget they want. Hence those markets that have either strong political might, advanced data modelling and knowledge skills, or just good sources of data, will more than likely come out of the process with more budget at the expense of other markets. The issue is that these markets are not necessarily the markets that represent the most efficient use of funds to achieve the highest overall sales/ profit.
One answer to all this could be to turn the process on its head and enforce budgets by market centrally. This removes the political and local market influence, but such a big step (if not already in place) may create ill-feeling among national marketing directors.
A more favourable option is to allocate the budgets centrally using a framework that the local markets can input into, based on a common process with common assumptions and data sources. To do this, the framework needs to be easy enough for all to understand, complex enough to incorporate all business elements, and use similar data sources across markets.
This framework can be used centrally to allocate and justify budgets and the onus is on the national marketing managers to justify why they should have altered budgets, but only when given the facts. This minimises political arguments, reduces time (Rounds one, two and five are now obsolete) and arrives at a more optimal split of money, ensuring markets are supported where return is greatest.
In my experience of working with international companies on market and brand portfolio allocation projects, there is a wide range of control that the centre has over the individual markets. As such, the success of the framework is highly dependent on the engagement process between the centre, the partnering consultancy and the local countries. Where there is a greater degree of local control, the process will take longer and needs to capture more visible inclusion of local market understanding.
The framework can consist of a range of methods, starting off with the bronze approach structured around key performance and cost metrics, up to the gold standard all-singing all-dancing optimisation and forecasting software.
The bronze approach is a good starting point. This gathers key metrics such as sales, profit, consideration metrics, cost of media, media inflation etc, and creates overall scores based on these metrics. This score, or index, then offers insight as to which markets are more attractive to invest in.
However, it doesn’t bring to bear key points for investment, such as how much to spend in those markets, due to its linear approach, nor effectiveness of advertising in those markets. As such, this bronze approach may be unacceptable for companies where there is a lower central control level – the approach is more likely to result in opposition by the local markets due to its lack of analytical rigour versus alternatives.
Market Mix Modelling (MMM) is a great tool to use in the first step to budget setting and allocation. However, it is only a first, but necessary, step: the ROI is not only informed by the effectiveness of the advertising, but also how much you are spending. Dixon and Shapiro spell this out in their article ‘Traditional ROMI is dead, long live marketing effectiveness’, where they cite that forecasting using MMM gave a forecast error of 13% compared with the more detailed, integrated approach which had only a 3% error range. This detailed approach included understanding of rapidly changing environments, long-term impacts and finally reach, or the advertising response curve.
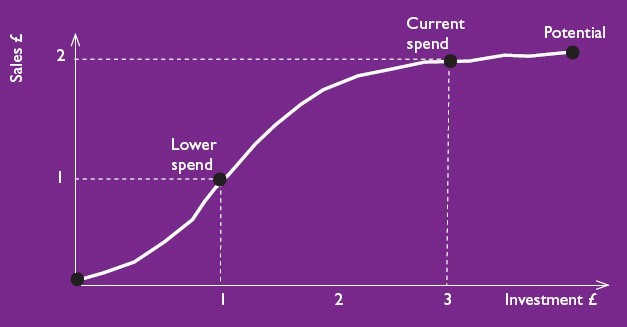
The response curve is a crucial factor in setting budgets. In Figure 1, if the client’s TV budget was at the current spending point, and MMM was used to measure the effectiveness, it would correctly measure the return and hence ability to calculate the ROI (in our example, £2 sales for £3 spend, £2/£3 = £0.66). However, if the client was actually to spend a reduced amount (one-third of the amount), and this spend returned only ½ the amount of sales, then the ROI has increased (£1 sales for £1 spend,£1/£1 = £1.00), as the proportionate amount lost in sales is less than the decrease in spend.
The reason this relationship of changing ROI exists at different budget levels is the diminishing returns effect of advertising. This is where, at higher spend levels, the efficiency of a medium starts to diminish as you begin to reach the same consumers again and again, and there’s also a finite level of demand for a product. (‘If I re-allocate part of my TV budget to print, will I get a better return?’ (Andrew Green, Admap, February 2006).
This diminishing returns effect means that if the initial MMM ROI were to be taken in isolation, then the TV medium in our example may not be an attractive investment opportunity. However, it shouldn’t be ignored in investment decisions because at lower spend levels it is an attractive medium. This application is critical in optimising across channels (Campbell and Bayliss, ‘How to make media investments accountable’, Admap, April 2005) and also across markets.
Obviously, there isn’t historical data to build response curves in all markets and for all channels, (McGowan and Meer ‘Advertising accountability: it’s bigger than ROI’, Admap, November 2006), but benchmarking and intuitive client discussions can get around this.
So the gold standard framework will build in the measured activity from MMM, and add further texture through building response curves. Future proofing the results is the next step to make sure the model has applicability in further years. This includes factors that historical data may not exist for, such as future economic trends, new product launches and new media creatives. These can be controlled for use in estimates and benchmarking against comparable events, such as a rival launching a similar product.
The next step is to include long-term impacts. Where the effect can’t be measured, academic research can help inform the tail – of which there is some very good literature. One of the landmark studies being the Lodish behaviour scan studies: ‘A summary of 55 in-market experimental estimates of the long-term effect of television advertising’ (Len Lodish et al: Marketing Science,August 1995).
The last step is then overlaying real-world factors and constraints: minimum spend thresholds for channels (cut-through) as well as pre-committed budgets (such as three-year sponsorship deals).
While building these curves using consistent datasets across markets, you can then give the opportunity for local markets to feed back into the process a further time. This gives the chance to contest relationships, build in these real world constraints and include new data – but only if it is truly justified.
Building these curves into a tool gives the ability to trade-off millions of possible combinations to arrive at optimal allocations for given scenarios.
Once built, this model enables the exploration of financial impacts of different investment decisions, including: altering the investment allocation between individual markets, sub-brands and media; changing the focus of the communications mix (total media versus total promotions) for the key investment targets across markets and the portfolio; and increasing and decreasing the total level of investment as well as the optimum budget scale for sales and profit maximisation.
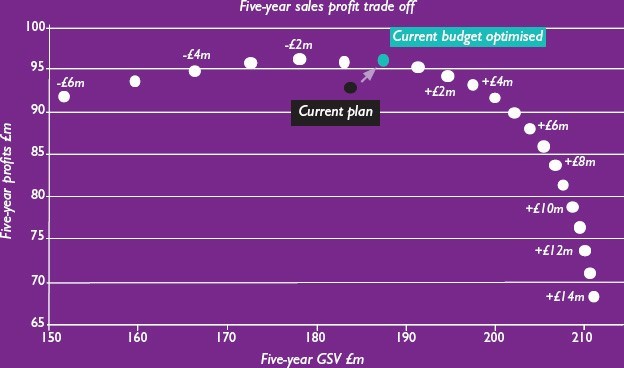
With regard to the latter point on optimum budget scale, this is a key benefit of the process. In Figure 2, the analytical framework has highlighted that there is no profit upside in increasing budgets beyond currently planned levels: the points on the graph are sales and profit simulations of changing the overall marketing budget by increments of £1million.
It is, therefore, possible to increase gross sales value (GSV) but it would be at a cost to profit. However, there is a significant benefit in better allocating the current budget across brands and also across media channels by moving from the black point to the turquoise point on the graph.
This approach can thus be used by the chief marketing officer/chief financial officer to frame budget discussions based on real data. So when asked the question of cutting budgets and minimising business impact, they can make the right decisions backed up with financial proof.
In practice, this altering budget happens throughout the year, so having something in place to simulate these changes and illustrate the reasons why is a massive time-saver.
Conclusion
In times of reduced budgets, local market politics and the need for increasing accountability, it’s important to have a budget process that everyone buys into, not only across markets but also across disciplines. In the interest of minimising business impacts of reduced budgets, transparency is key and building a budgeting framework can go a long way to iron out the pains of the process.
Delivering corporate accountability and ROI improvements will help put marketing further up the agenda. Optimising the marketing mix on a single brand typically delivers ROI increases of 15% or more; further optimising across a portfolio of brands, and then across markets, the overall ROI improvement internationally is huge.
Brightblue Consulting are a London based consultancy which help businesses drive incremental profit from their data. We provide predictive analytics that enable clients to make informed decisions based on data and industry knowledge. Through Market Mix Modelling, a strand of Econometrics, Brightblue has a proven track record showing a 30% improvement in marketing Return on Investment for clients’ spend. If you are interested to find out more please contact us through email by clicking here and one of our consultants will get back to you shortly.
This article was first published in Admap November 2011 written by Michael Cross.